The post-pandemic era has been defined by fiscal dominance — an economy fueled by government deficits and short-term Treasury issuance that kept liquidity elevated even as the Fed held interest rates high.
Today, we’re entering a phase of private-sector dominance, where the Treasury is withdrawing liquidity through tariffs and spending constraints compared to the past administration.
That’s why rates need to drop.
In this week’s report, we break down the current cycle through the lens of Global Liquidity to highlight why the current iteration of the “debasement trade” is on its final legs.
Disclaimer: Views expressed are the author’s personal views and should not be relied upon as investment advice.
The DeFi Report is powered by BIT Digital, the leading global platform for high-performance computing infrastructure and one of the largest ETH Treasury firms. NASDAQ: BTBT
Is Fiscal Dominance Ending?
We always want to zig when everyone else is zagging.
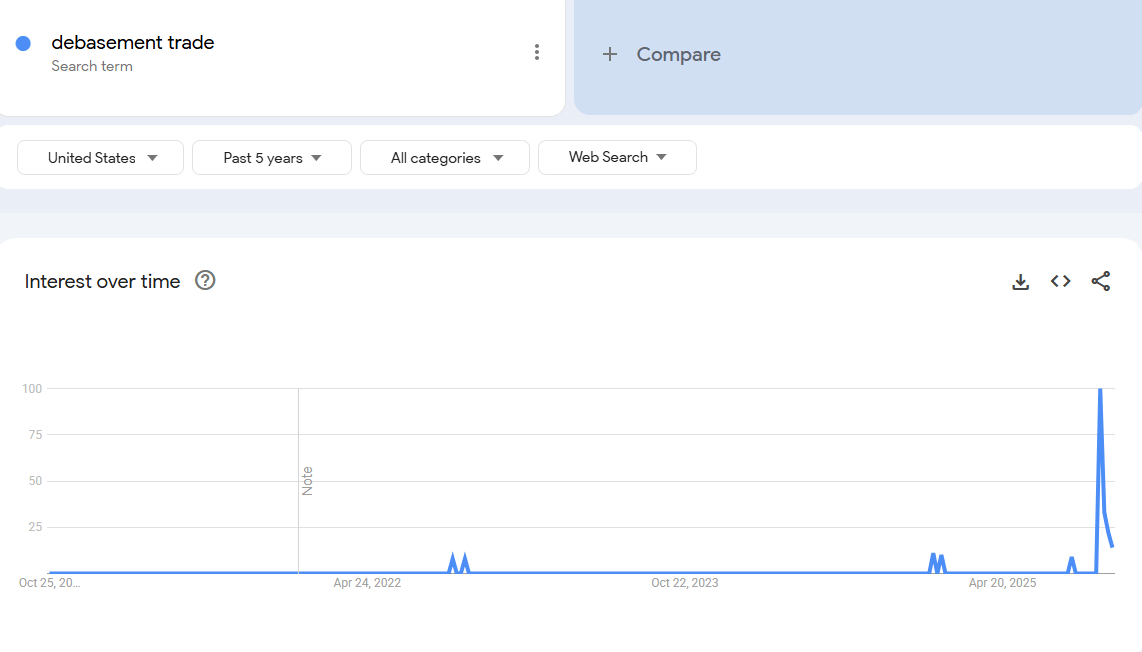
That’s why all the talk about the “debasement trade” of late is catching our attention.
It’s our view that the time to be interested in the “debasement trade” was a few years ago. When BTC was $25k. And Gold was $2k. Back when nobody was talking about it (besides crypto & macro analysts).
The “trade” has largely played out, in our opinion.
And so, it’s our job to understand the conditions that created it, and whether those conditions will continue to persist.
What drove the trade? Two primary factors, as we see it.
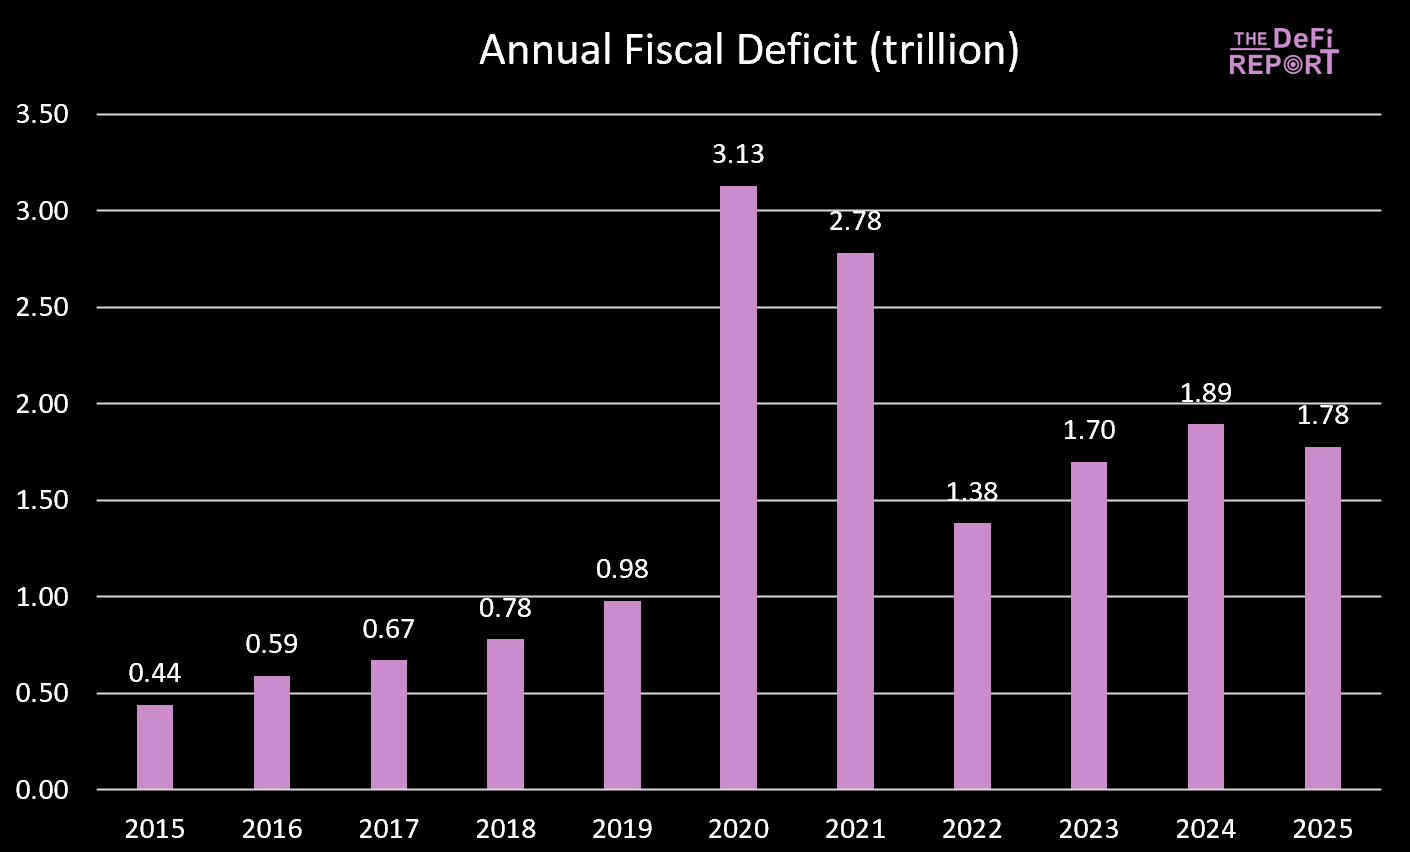
Treasury Spending. We ran massive fiscal deficits under Biden.
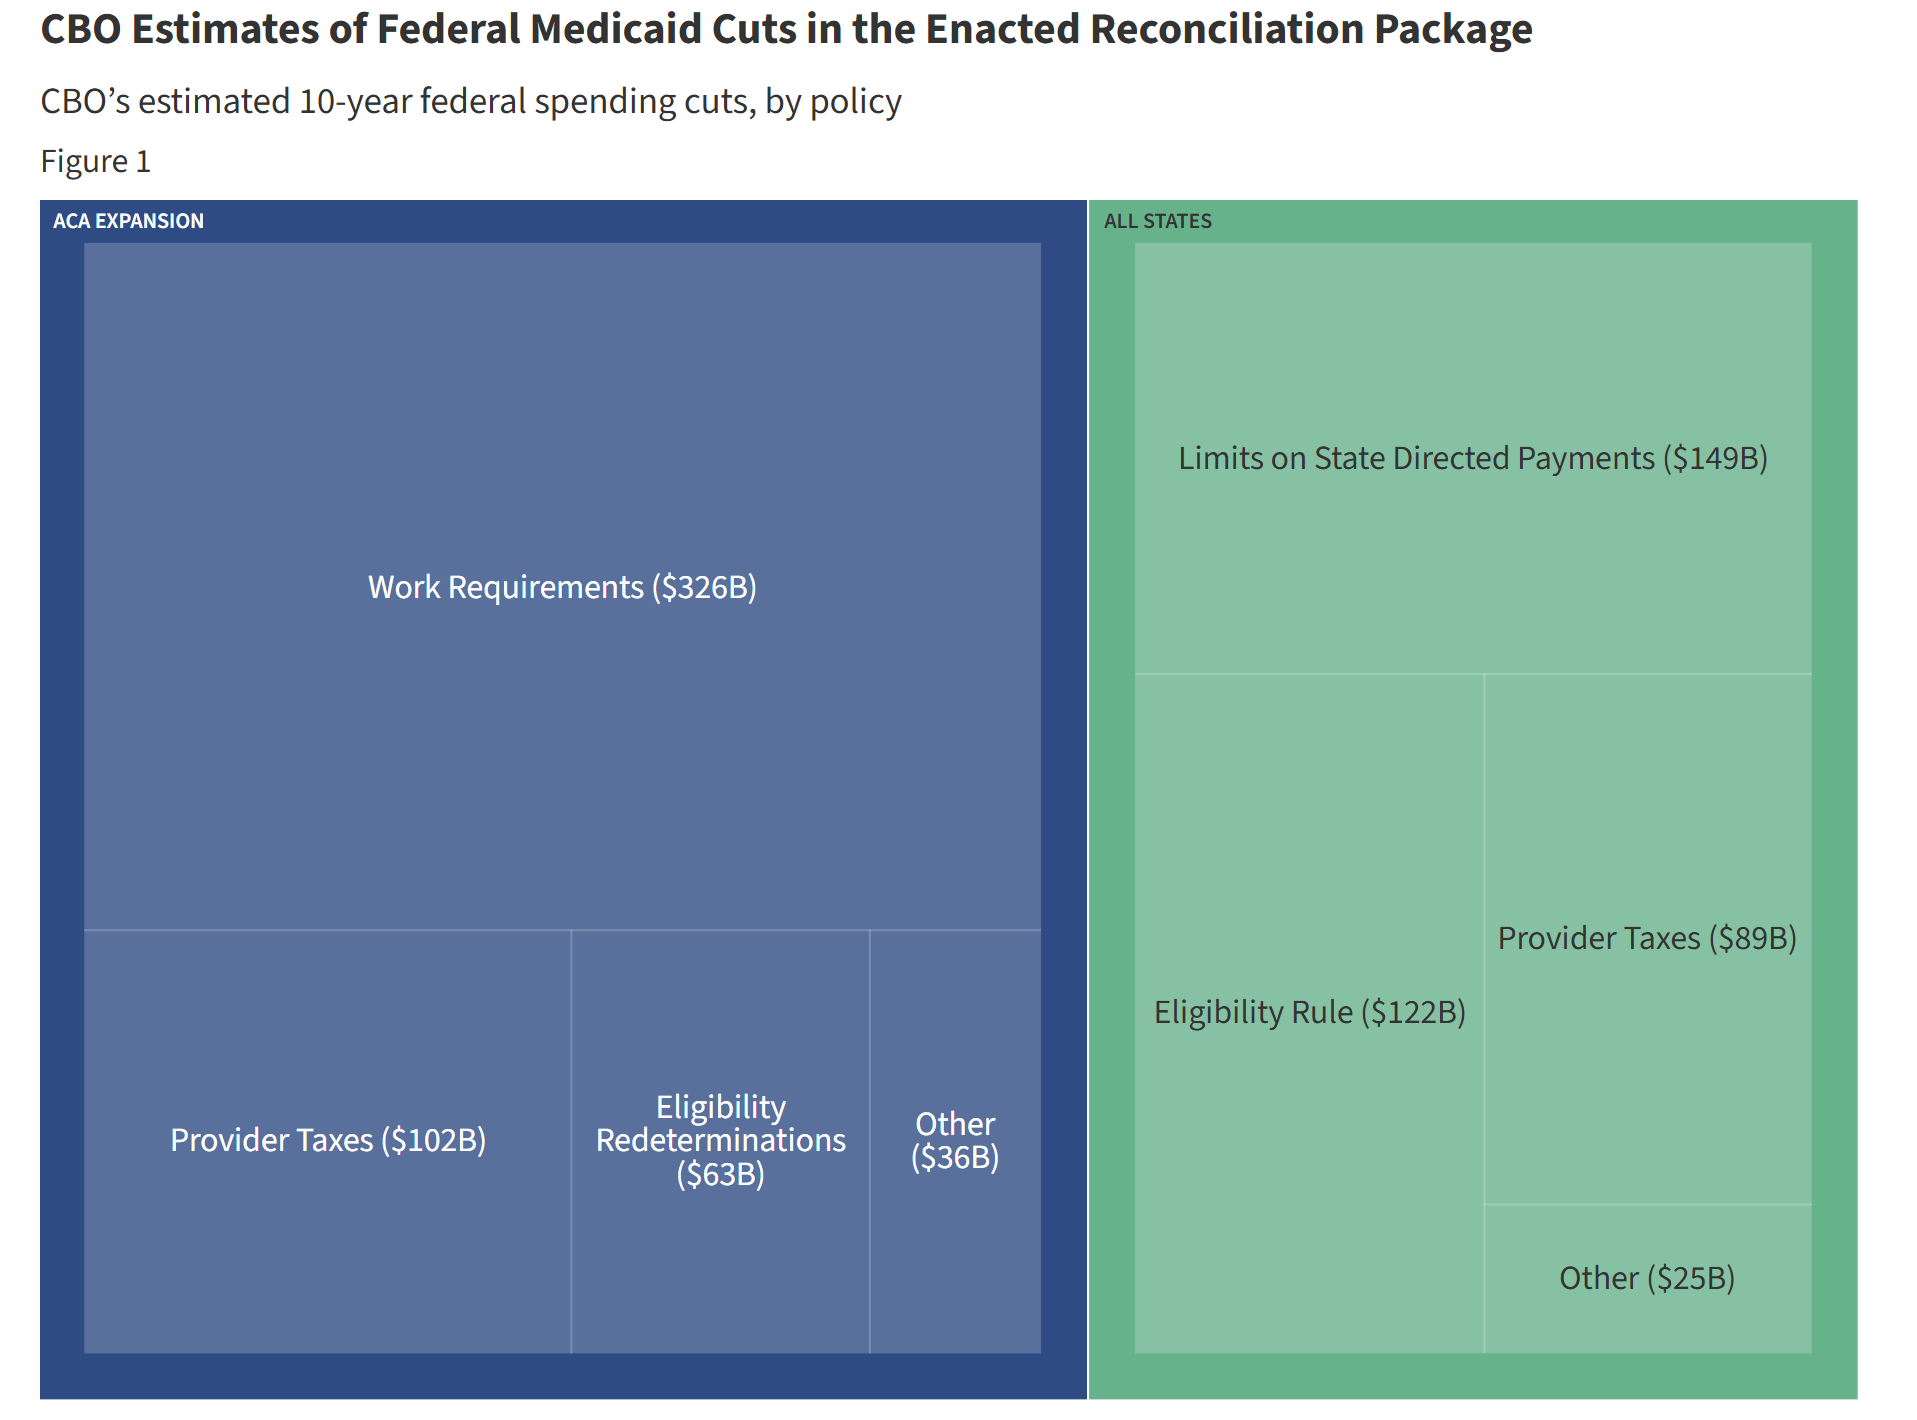
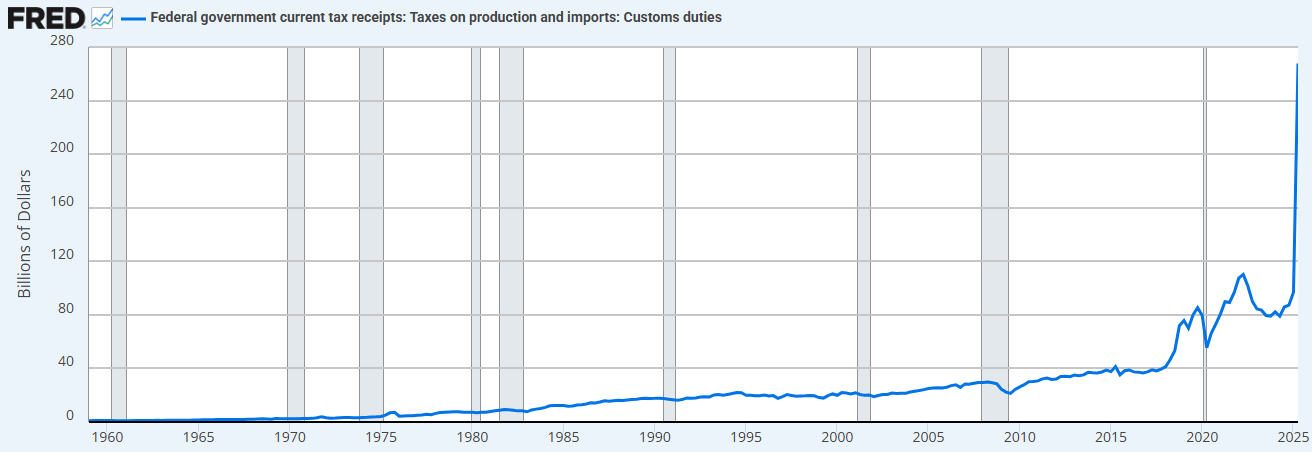
FY ‘25 just ended with the deficit dropping slightly — mainly due to rising tax receipts (tariffs) rather than a drop in spending. However, spending cuts are anticipated in the Big Beautiful Bill via reductions to Medicaid and SNAP benefits.
During the Biden years, government spending and transfers provided a steady injection of liquidity into the economy. But under the Big Beautiful Bill, the spending growth slows.
That’s less capital being pushed into the economy from the government.
Furthermore, we have the government pulling capital out of the economy via Tariffs.
The combination of spending restraint (relative to the prior administration) and tariff increases means the Treasury is now absorbing liquidity rather than supplying it.
That’s why we need rate cuts.
“We are going to re-privatize the economy, reinvigorate the private sector, and shrink the government sector.”
“Treasury QE.” To fund the excessive spending via the Treasury under Biden, we also saw a new form of “QE.” We can observe this below (black). “Treasury QE” helped to prop up markets by funding government expenditure via short-dated bills, rather than longer-dated coupons.
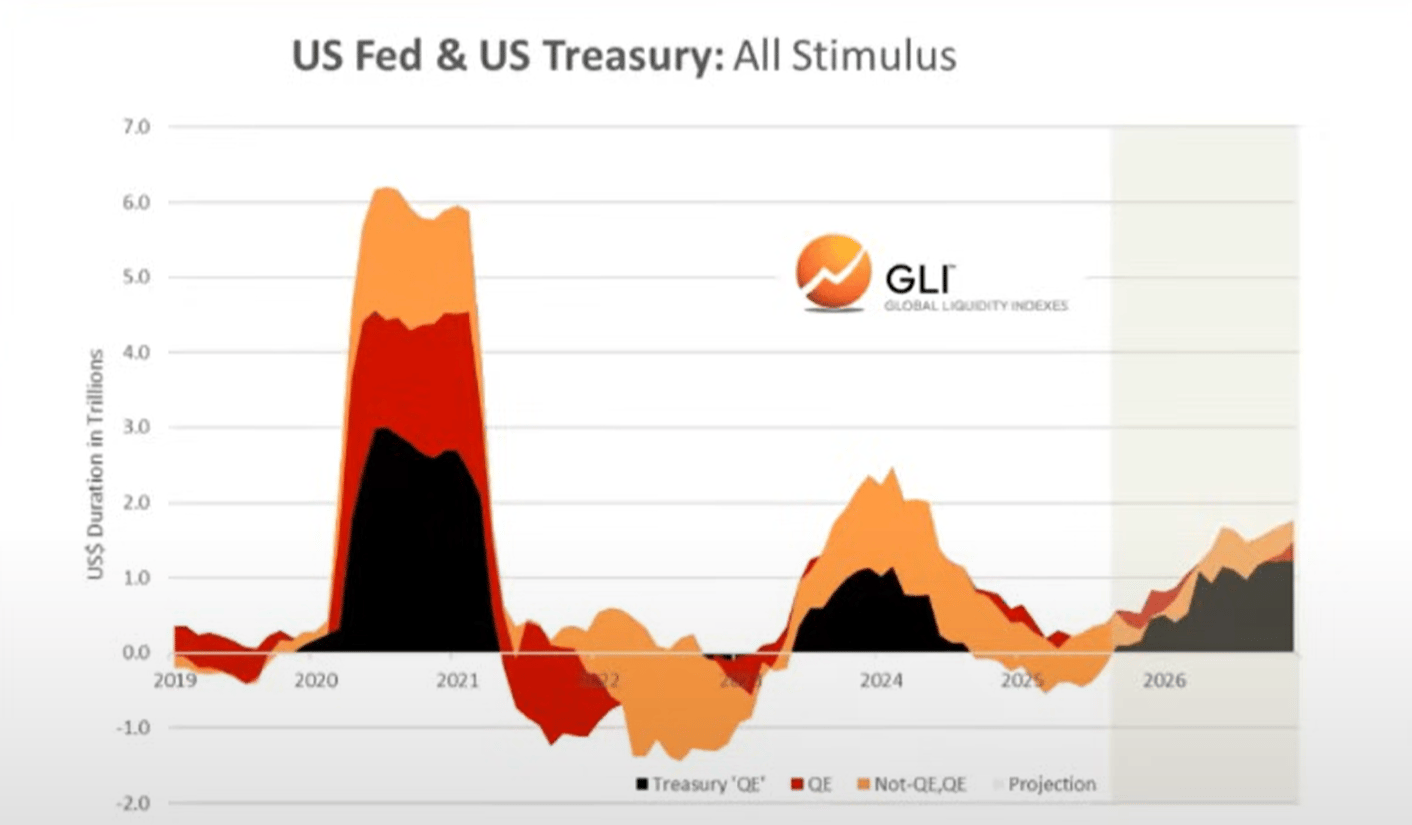
Data: Global Liquidity Index
It’s our view that treasury spending and treasury QE are what drove the “debasement trade” and the “everything bubble” we’ve seen play out over the last few years.
But now we are transitioning to the “Trump Economy,” with the private sector taking the baton from the Treasury.
Again, this is why they need rate cuts. To get the private sector going via bank lending.
As we enter this transition period, the Global Liquidity cycle appears to be cresting…
The Global Liquidity Cycle is Rolling Over
The Current Cycle vs the Average Cycle
Below, we can observe the current cycle (red) vs the historical average since 1970.

Data: Global Liquidity Index
Asset Allocation
Building on Mr. Howell’s work from Global Liquidity Index, we can observe the typical liquidity cycle and how it aligns with asset allocation.
Commodities tend to be the last thing to go, which is precisely what we see today (gold, silver, copper, palladium).
From this view, the current cycle looks quite typical.

Data: Global Liquidity Index
Now. If liquidity is in fact cresting, we expect investors to rotate into cash and bonds as conditions shift. To be clear, this part of the process has not yet started (markets are still “risk-on”).
Debt to Liquidity
Per Global Liquidity Index, debt-to-liquidity for the major economies hit its lowest level since 1980 late last year. It’s now on the rise, and projected to move higher into ‘26.

Data: Global Liquidity Index
A rising debt-to-liquidity ratio makes it more difficult to service the trillions of dollars in outstanding debt that require refinancing.

Data: Global Liquidity Index
BTC & Global Liquidity
Of course, BTC “called the top” in Global Liquidity in the last two cycles. In other words, BTC peaked a few months before Global Liquidity rolled over, seemingly anticipating the decline.

Data: Global Liquidity Index
We don’t know if this is, in fact, playing out right now. But we do know that the crypto cycle has followed the liquidity cycle.
Alignment with the Crypto Cycle

Data: Global Liquidity Index
Portfolio Management
TDR Pro
Upgrade to finish reading the report.
Already a paying subscriber? Sign In.
TDR Pro Members Receive:
- • Macro + onchain data "cycle awareness" updates
- • Full access to our portfolio positions
- • Average entry price for each position
- • % of the portfolio in each position (including cash)
- • Weekly update on what we are buying/selling
- • Clear thesis & supporting analysis for any portfolio changes